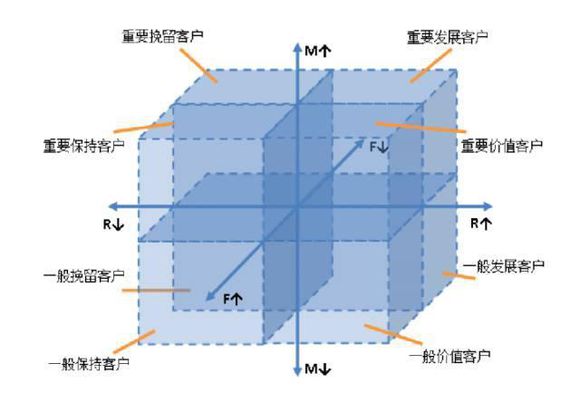
看到过基于LRFMC模型的航空客户分类,试试对我司的客户进行分类。
如何通过RFM模型,为用户分群,实现精细化运营
RFM模型是一个被广泛使用的客户关系分析模型,主要以用户行为来区分客户,RFM分别是:
- R = Recency 最近一次消费
- F = Frequency 消费频率
- M = Monetary 消费金额
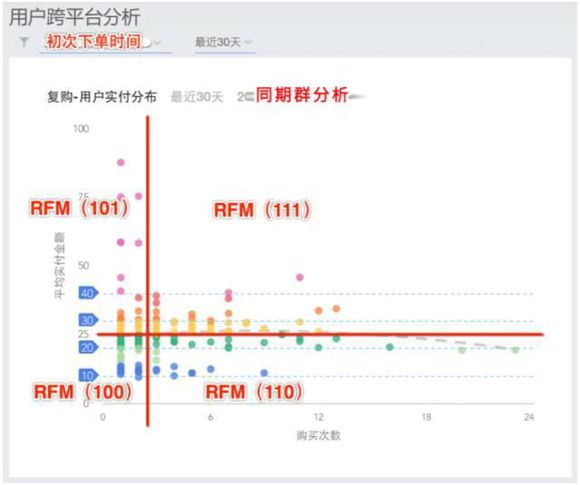
- 第一步:先挑出来近1个月的复购用户。
- 第二步:近1个月内复购用户的平均实付金额做纵轴。
- 第三步:近1个月内复购用户的购买次做横轴,生成表格。
- 第四步,你需要自己在这个表格上划红线。横着的红线,平均消费金额,竖着的红线,平均消费次数。

识别价值客户
- R(消费时间间隔,最近消费时间距离观测点的时间间隔)
- M(当然是消费总额了)
- F(消费频次),
- L(关系存续时长)
- C(平均折扣),这个C我没有
数据清洗
数据归一化
- 使用常见的标准差归一化数据
- (x-x.mean(axis=0)/x.std(axis=0)
K-Means 基本使用
1
2
3
|
import pandas as pd
data=pd.read_excel('e:/蒙捷物流/门店拣货数量.xls',index_column=None)
|
WARNING *** file size (53730112) not 512 + multiple of sector size (512)
1
2
3
|
data1=data[['生成时间','拣货门店','件数']]
data1.info()
|
<class 'pandas.core.frame.DataFrame'>
RangeIndex: 54879 entries, 0 to 54878
Data columns (total 3 columns):
生成时间    54877 non-null datetime64[ns]
拣货门店    54877 non-null object
件数      54877 non-null object
dtypes: datetime64[ns](1), object(2)
memory usage: 1.3+ MB


1
2
3
4
5
6
|
data1=data1.dropna()
data1=data1.drop(data1[data1.件数=='0'].index)
data1.head()
|

1
2
3
4
5
|
import re
f=lambda x:int(re.sub('\D','',x))
data1.件数=data1.件数.map(f)
data1.info()
|
<class 'pandas.core.frame.DataFrame'>
Int64Index: 54257 entries, 6 to 54876
Data columns (total 3 columns):
生成时间    54257 non-null datetime64[ns]
拣货门店    54257 non-null object
件数      54257 non-null int64
dtypes: datetime64[ns](1), int64(1), object(1)
memory usage: 1.7+ MB
1
2
3
4
5
6
7
8
9
10
11
12
13
14
15
16
17
18
19
20
21
22
23
24
|
M=data1.groupby('拣货门店').sum()['件数']
Times=data1.groupby('拣货门店').count()['件数']
First_time=data1.drop_duplicates('拣货门店',keep='first')
Last_time=data1.drop_duplicates('拣货门店',keep='last')
First_time=First_time.set_index('拣货门店')['生成时间']
Last_time=Last_time.set_index('拣货门店')['生成时间']
d=pd.concat([M,Times,First_time,Last_time],axis=1)
d.columns=['M','F','First_time','Last_time']
end_time=pd.to_datetime('2018-09-20')
d['L']=(d.Last_time-First_time).dt.days
d=d.drop(d[d['L']<=0].index)
d['R']=(end_time-d.Last_time).dt.days
d['ZF']=d['L']/d['F']
|
1
| d1=data1.set_index('生成时间')
|
1
2
| d=d[['M','L','R','ZF']]
d.head()
|

1
2
|
d1=d.apply(lambda x: (x-x.mean(axis=0))/x.std(axis=0))
|

1
2
3
| from sklearn.cluster import KMeans
kmode=KMeans(n_clusters=4,n_jobs=4,max_iter=1000)
kmode.fit(d1)
|
KMeans(algorithm='auto', copy_x=True, init='k-means++', max_iter=1000,
    n_clusters=4, n_init=10, n_jobs=4, precompute_distances='auto',
    random_state=None, tol=0.0001, verbose=0)
array([[-0.20778844, -1.13408314, 1.30125341, -0.49642668],
[-0.24994031, -0.22291813, 0.01485693, 1.47776371],
[ 0.07186423, 0.61106574, -0.5932065 , -0.4025806 ],
[ 9.00211981, 0.41519412, -0.69211313, -0.83961275]])
array([2, 2, 2, ..., 0, 2, 0])
1
2
| c1=pd.Series(kmode.labels_)
c1.value_counts()
|
可以看到 每一类 具体数量
2 545
0 250
1 237
3 8
dtype: int64
1
| d['labels']=kmode.labels_
|


